
No one is going to argue with the notion that education should be, and can be a social equalizer? Closing the gap (which should read attainment and progress) between disadvantaged and other pupils is a high priority in our Academy, as it is in many schools, brought into sharp focus by accountability measures. A gap that despite the focus (and funding) widen in 2014 (5A*-C EM increased from 27.0% to 27.4%). Despite this apparent widening, do not overlook the inherent limitations with any first past the post, threshold type measure. Lower ability pupils have been improving more rapidly than the other pupils since 2005, however they have not yet improved enough to cross the C grade threshold. Meanwhile, more middle ability pupils, improving at a slower rate, must have crossed the threshold for the gap to have widened.
We continue to discuss attainment and progress gaps all the time the accountability framework measures them. On positive note, Ofsted are sharing their evidence base – ‘The most able students: An update on progress since June 2013’ published on 4 March 2015, and explaining further in their public communications. The third key point from Sean Harford’s recent ASCL speech clearly outlining for school leaders that the progress and achievement gap for most able children from disadvantaged backgrounds” will receive critical review.
- Values, “particular challenging intolerance.”
- “The three key factors that determine whether a school remains good,” leadership, address known weaknesses and a culture of aspiration.
- “…sharpening its focus even more in the coming months on the progress and achievement of the most able children from disadvantaged backgrounds.”
As schools leaders our first step will be to ensure that we are able to assess the progress and achievement of most able children from disadvantaged backgrounds. At The Wellington Academy, we use 4Matrix so creating a research group is the product of a double filter, then creating a research group. Second, we need to ensured that those staff working with either the most able or the disadvantage groups (rarely “and”), know they need to work together.
Definitional debate
There are definitional issues. @giftedphoenix definitively dissects the complexities of most able cohort. Currently the most able cohort are in fact “most high attaining” at Key Stage 2, this is most certainly not the accurate. The fact that approximately half of high attainers at KS2 are high attainers at KS4, underlines the need for a more robust definition. High attainers at KS2, are all rounders – though often the case, this is not accurate. The relatively small national cohort of FSM6 and most able (approx. 28,000), subsequent statistically small within school FSM6 and most able cohort. Further to the inverse relationship between the proportion of high attainers and the proportion of disadvantaged learners pointed out by @giftedphoenix. Accepting this, we move onto the next step.
Progress and attainment indicators
Re-read “The most able students – An update on progress since June 2013.”
Next, investigate the progress and attainment indicators of most able children from disadvantaged backgrounds against their most able, non-disadvantaged peers. Benchmark your school, be informed and prepared for any Governor inquiry, support visit or inspection. Do not start with the 5A*-C EM threshold measure.
5A*-C EM, the most commonly used indicator, simply amplifies the issues of disadvantage. Why? Because disadvantaged pupils, typically arrive at school with lower attainment than their non-disadvantaged peers and within each key stage, make less progress – hence as a result, they are less likely to cross the C grade threshold than their non-disadvantaged peers. Conversely, the 5A*-CEM has no discernible value in discriminating the progress and attainment of the most able pupils (KS2 APS 30+) disadvantaged (84%) or not (94%), as almost all most able pupils cross the C grade threshold. Start with the proportion of A*/A grades and A*-B grades at English or Maths GCSE.
EPAS 2014 Data
The data is not easy to come by, so my sincere thanks to Rhian Davies who shared the raw EPAS data used in this analysis. Assistant Headteacher, Maths and data geeks are good to know.
I did not have access to the same data sets as Ofsted analysts, specifically the A*-A and A*-B attainment percentages for English and maths, however the achievement gaps are evidently clear, for the broader measures of 5+ and 3+ A*-A. Note the Capped APS gaps. Incidentally, the Survey reported the English GCSE A*-B gap (13%) Maths GCSE A*-B gap (17%).
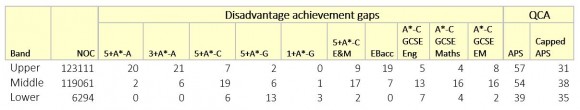
The 5A*-CEM gap and A*-C attainment for English GCSE and maths GCSE clearly evident for middle ability pupils. Using the Transition Matrix data @GiftedPhoenix transferred and representated these gaps to the graphically. Another reason to question the all-rounder definition. The broader measures of APS and Capped APS suggesting that an inspections evaluation may well be influenced if the indicator is not defined by Ofsted.
Has the indicator by which inspectors will draw their conclusion been defined? Again, I would suggest the broader 5+A*-A or 3+A*-A (rather than the 2013 Survey measure) as a robust and more indicative measure of a school impact. Furthermore that 4 Levels expected progress underlines a commitment to aspiration.
Lines of inquiry
Complaints of complacency or statements suggesting that “the performance of the most able students was not a high priority…” are only warranted by the hard data and a wider view is required (especially within schools analysis). Are most able, disadvantaged pupils more likely to experience second, third or even forth performance alerts that impact on their progress and attainment? Or at least, on average, experience more performance alerts than their non-disadvantaged peers? Common sense and practical experience would suggest that this may well be the case. Are disadvantaged pupils more likely to be young carers, to have experienced greater school mobility, to have lower attendance or be of an ethnic minority?
What is the KS2 APS score for most able pupils compared to and their most able disadvantaged peers? What is the gap at the start of KS3?
Further investigation on the rates of progress is required.
How is the unique issue of late academic progress and attainment for pupils with EAL accounted for? Pupils who are clearly most able, but not at the point of transition?
Why are the gaps for A*-A larger across all Level 5 sub levels in maths than in English?
How will the size of a schools most able cohort be factored?
To what extent does the more able and / or disadvantage density impact on school effectiveness?
National data sets for most able and disadvantaged are secure. School cohort sizes are far less secure. At The Wellington Academy for example, cohorts of just 5 most able disadvantaged pupils. How to proceed?
Most able and disadvantaged – now
- Set demanding, high and supported expectations from the get go, that includes transition.
- Set more challenging homework for the most able.
- Plan and direct challenging questions and differentiated tasks.
- Spend time identifying barriers to learning of individual most able / FSM6 pupils before you decide what strategies to adopt.
- Spend time discussing individual pupils in your team meetings, solution circles are an effective way to share information and discuss ideas.
- Don’t just assume that one approach will work or what works for one pupil is needed or required for another.
- Signpost the exit routes – aim higher.
- Use a staff noticeboard to allow staff to add and share comments on what works with certain, key pupils.
- Ask the pupil what works for them.
- Consider a range of teachers, other adults, sixth form pupils as academic mentors. Connect mentoring to the assessment cycle.
[qr_code_display]