We have taken a very simple English and Maths spreadsheet and blown it in our staff room for all our staff to see. On the Y axis, Maths working at grade, on the X axis, English working at grade. Each ID card shows the pupils photo and their KS2 Maths and English grades. Each term we simply update the pupils position.
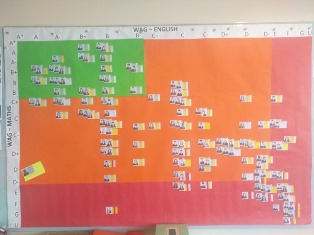 It got me thinking, what would a similar chart look like for 3 Levels of Progress and what could we learn from it?
[qr_code_display]