
Any day that starts with bacon baps has a potential to become a good day. The ASCL Leadership of Data most certainly turned out to be a “good day,” more importantly it was an informative and insightful day that will impact on how we forward plan at our school.
The conference opened with a warm welcome from Peter Kent – ASCL President and Headteacher at Lawrence Sheriff School, swiftly backed up by the annual “Data – an update on the wider picture” – from Duncan Baldwin, ASCL Deputy Policy Director. Perhaps one of the most compelling reason to attend the “ASCL – Leadership of Data” Conference, Duncan’s comprehensive review signals policy about to impact on our schools and sign posts future policy developments that we should be considering when considering the our slightly long-term plans (of course not all signposts lead to policy, but that’s somewhat the nature of politics and school leadership) .
Duncan Baldwin’s restrained opening (no joke this year), swiftly moved to the proscribed outline, albeit potted with “double-think” (a literary, “1984” Orwellian reference) to numerous subtle policy u-turns, often previous signposts in his annual policy update.
Relevant KS2 changes, preceded a more comprehensive KS4 policy review with KS5 changes available as a resources.
The thorough dissemination of the “Statement of intent,” and impact of Wolf. Reporting of first rather than best entry and the intention to publish destination measures.
RAISEonline
RAISE (quite a lot of changes here). The good news, there are no new measures, though new methodologies. A few important cursory notes, many of the current Y11 will not have KS2 test data due to the KS2 test boycotts, so be aware of Teacher Assessments used as a proxy for test results (the mean fine grades are not the half-way points). There was a brief summary of “Educational Importance” for disadvantaged pupils and a reminder that RAISEonline offer more detail through the interactive reports. Finally a discussion of “Closing the gap,” and destinations measures.
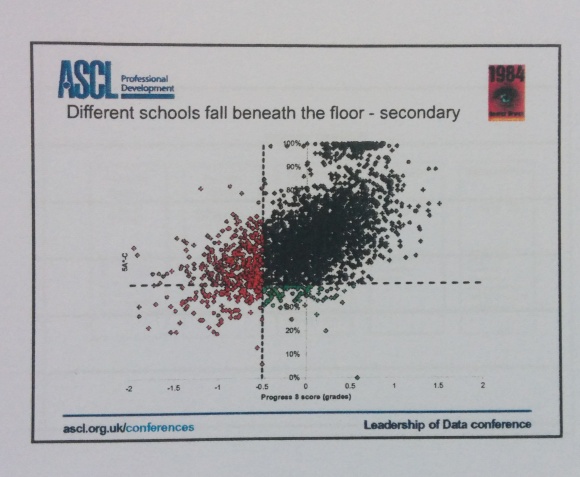
Progress 8
The message pertaining to opting in to Progress 8 measures was crystal clear, wait. There is still more information to come. If you needed a concise and accurate visual presentation of the impact of the new floor standards then Duncan Baldwin delivered it. The current and the new floor standards (albeit with early data) certainly casts a different perspective on accountability.
A stark reassessment of accountability?
Making Sense of all the data
Next, David Blow, Headteacher at Ashcombe School, with “Making Sense of all the data.” Covering all the essentials data sources and the timeline for data releases, David (data hunter-gather) ensured we knew when where to get our information. As per his annual presentation, David presented the key facts and offered a range of pertinent information and sage advice, just a few notes;
The RAISEonline interactive reports has more, and important, information that is not available in the printed reports Ofsted inspectors receive. Make sure they get the reports you want them to see.
David offered a timely reminder to explore the impact of thresholds, means and outliers.
When a measure becomes a target, it ceases to be a good measure – Goodhart’s Law
He reminder us all, that what others schools do, will impact on your school measures, no where is that more clear than in a) multiple entries (up from 30,000 in 2009 and 400,000 out of 600,000 in 2012) and the number of GCSE students sit. What is your school entry profile like when compared to the national?
David noted that note all subjects are equal, that there is still a lack of comparability between different GCSEs and equivalences. Attainment 8 and Progress 8 measures should be considered as five separate measures.
A firm advocate of transition matrices, David recommended schools compare their own grades for each subject and sub-level with the national performance. Giving a more representative performance comparison of your pupils performance.
(David makes many of his resources available via the ASCL website and I highly recommend you log in and grab yourself a copy.)
There was just time for a review of GCSE Maths and English over time and an assessment of entry variations and the impact of iGCSE.
Pupil Premium: are we closing the gap?
Mike Treadaway Director of Research at Fischer Family Trust concluded the morning keynotes with a forensic looks and discussion of the “gaps” and groups within groups.
After our second discussion of thresholds and means, Mike recommended we investigate our disadvantaged students not only by thresholds but by progress 8 and attainment 8 measures before demonstrations a very practical way to present your Pupil Premium impact.
One number does not summarise our schools. – Mike Treadaway
Mike shared the data behind the “invisible” group – that is pupils FSMever or FSM12 and compared their attainment to FSM6 pupils. The brief and worrying conclusion that FSM12 and FSM6 shared a very similar attainment profiles.
That brings you up to the mid morning workshops… I have not summarised the afternoon’s OFQUAL and DFE presentations, most of the information is on their websites, though hearing from both parties was reassuring.
To sum up, this not an event a school can you can afford to miss. If you are new to data, it is similar to the ice-bucket challenge, it will take your breath away and leave you feeling that you have purpose. If you are an experienced school data leader it is nothing short of worthwhile. If you can afford to miss this event – if it can only be due to the fact that you have staff who can dedicate themselves to comprehensive policy review and hardened, sharp eyed, statistical experts dedicated to making the unwieldy, insightful.
[qr_code_display]