Warning – data post. Codes, tables, letters and far too many abbreviations.
This afternoon I find myself on a data quest. How to handle B/N grades for KS2 with and without Teacher Assessments (TA) for the process of calculating progress measures?
Adjustment made to KS2 test scores using Teacher Assessment (TA) data
| If test score = | ||
| 3-5 | Use pupil’s fine grade score | |
| 2 | If TA available | Award: W = 3 Level 1 = 9 Level 2 = 15 Any higher = use pupil’s fine grade score A,D,F,L,P,Z = Exclude pupil |
| If no TA available | Exclude Pupil | |
| B, N | If TA available | Award: W = 3 Level 1 = 9 Level 2 = 15 Any higher = 15 (capped) A,D,F,L,P,Z = Exclude pupil |
| If no TA available | Exclude Pupil | |
| A, M, Q, T, X | If TA available | Award: W = 3 Level 1 = 9 Level 2 = 15 Level 3 = 21 Level 4 = 27 Level 5 = 33 Any higher = 33 (capped)A,D,F,L,P,Z = Exclude pupil |
| If no TA available | Exclude Pupil | |
In previous years, in calculations of KS2 variables for use in VA measures, a pupil awarded a B (‘Below the level of the KS2 Test’) or an N (‘Not awarded a Test level’) in any test are assumed to be at the equivalent of Level 2 and awarded 15 points. From 2011, it has been decided to substitute Teacher Assessment (TA) data (capped at 15 points) for these pupils. The intention is to better reflect the attainment of these low attaining pupils, and to remain as consistent as possible with the methodology used in measures of expected progress.
TA data is also substituted for any test in which a pupil is awarded Level 2. The approach retains the test fine grade score for pupils who gain a TA of Level 3 or above (on the assumption that these pupils are working at a higher level, were correctly entered to the test, but didn’t perform as well as expected on the day), and discounts the fine grade score for those who gain a TA of Level 2 or below.
If a pupil is awarded a Level 2, B or N in the test and no TA exists, the pupil is excluded from VA measures, as we have no means of validating the pupil’s actual ability.
With no test score or teacher assessment, the student is excluded? We will see.
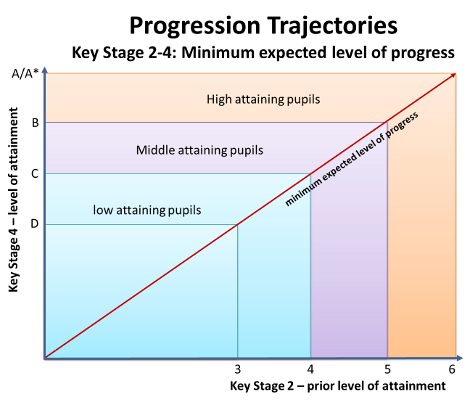
I also found this useful image on the main information site to communicate UML and expected levels of progress.

Lastly – this useful table for describing KS2-4 ‘Best 8’ VA measure (centred on 1,000).
| 1,036.5 and above | Top 5% of schools nationally |
| 1,014.2 to 1,036.4 | Next 20% of schools nationally |
| 1,005.7 to 1,014.1 | Next 15% of schools nationally |
| 994.5 to 1,005.6 | Middle 20% of schools nationally |
| 985.8 to 994.4 | Next 15% of schools nationally |
| 964.4 to 985.7 | Next 20% of schools nationally |
| Below 964.3 | Bottom 5% of schools nationally |
[qr_code_display]
Pingback: Data Glossary for School Improvement | KristianStill/Blog