
With the release of the interactive transition matrices last week, the breaks in the weekend was spent investigating the national data sets. Trying to learn from what the data was telling us.* Curious where the borderline C grades were achieved, and potentially lost, for English and Maths students in particular.
English
| Prior Attainment | D+ | C+ |
| 3c | 90% | 10% |
| 3b | 81% | 19% |
| 3a | 70% | 30% |
| 4c | 50% | 50% |
| 4b | 27% | 73% |
| 4a | 12% | 88% |
| 5c | 3% | 97% |
| 5b | 1% | 99% |
| 5a | 0% | 100% |
The GCSE English table speaks for itself, though offer completely insufficient information upon which to make school decisions. It is merely a very broad picture of the grade battle grounds. For English staff, the 4c to 4b, is where ground can be gained (if these were not the type of students who benefited from multiply entry, which they arguable would have been.) The high flying 5’s coasting to expected progress, certainly the 5b and 5a students.
Maths
| Prior Attainment | D+ | C+ |
| 3c | 91% | 9% |
| 3b | 80% | 20% |
| 3a | 65% | 35% |
| 4c | 41% | 59% |
| 4b | 22% | 78% |
| 4a | 9% | 91% |
| 5c | 3% | 97% |
| 5b | 1% | 99% |
| 5a | 0% | 100% |
The GCSE Maths table (again completely insufficient information upon which to make school decisions) shows a 9% greater likelihood for the 4c achieving a C+ grade. A performance gap between English and Maths that then narrows through to the level 5’s. The 3a/4c borderline is worthy of further investigation.
| C | B | A | A* | D+ | C+ | ||
| 4c | English | 41% | 8% | 1% | 0% | 50% | 50% |
| Maths | 50% | 8% | 1% | 0% | 41% | 59% | |
| 4b | English | 50% | 20% | 3% | 0% | 27% | 73% |
| Maths | 57% | 18% | 3% | 0% | 22% | 78% | |
| 4a | English | 42% | 35% | 11% | 1% | 12% | 88% |
| Maths | 48% | 31% | 10% | 1% | 9% | 91% |
Ebacc
Then there are the ebacc and foundation subjects. I started looking at the performance of these subjects, transposing the data into a range of easy to view charts and quickly realised I was basically creating the familiar ALPS chance graphs. For what these are worth (yes again completely insufficient information upon which to make school decisions) these are presented here.
Take German for example. 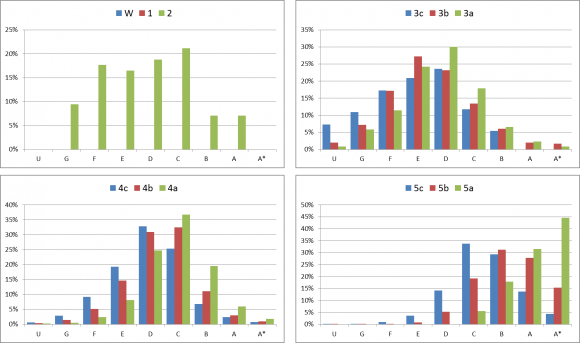 There is a 29% achievement gap in the performance of 4c and 4as. Make sure your 5c’s (and 5b’s) take their language GCSE seriously, with one in five not gaining a grade C.
*It is worth acknowledging that schools have been steered towards a single entry pattern. FFT have already released a paper on the impact that single entry may have.
[qr_code_display]