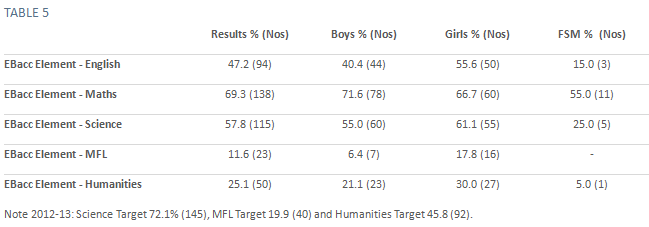
You know it’s been an exciting day when you get a post title like the one above and yet, I hope I might be able save my data colleagues some valuable time. Having written (and re-written and updated) my first governors report, I learnt the importance of labels, especially when converting data tables to charts and graphics.Of course, as we know, the cohort sample size is important, so half way through I started to add them directly to the tables and spreadsheets.

 These figures were very useful when adding information to charts. Setting the column names with the cohort size presents just a little more information with little effort. At the meeting, this simple addition, proved valuable particularly when reviewing data sets were the cohorts size was small. The visual presentation of children in care, or indeed SEN data, most definitely benefited.
Hardly profound, but true.
[qr_code_display]
Another bonus was that I found that MS WORD had a report template that tracks all the structural components of your report and auto updates your contents table.

Good idea, meaning no harm at all I find as much clarity as possible for governors is vital, including avoiding acronyms as far as possible (easier said than done in this world of data and targets).
But you’ve hit on a more interesting point of small sample sizes. Wen dealing with small groups of children at what number of children do you think it is reasonable to start holding staff to account?
Is it fair to hold a SENCO to account on the performance of 5 statements students for example. One could argue that with such small numbers its easy to track and intervene, but realistically it’s a statistically insignificant number, comparing those 5 students to, say, 7 the year before is statistically dodgy in the extreme. I still haven’t worked out the answer to this myself. My gut feeling as a mathematician says at 30 pupils upwards its fair to compare but below that you’re on shaky ground. Opinions?
Under 30, under 20. I think this is where CIs are also important. Certainly the gaps must be reducing (ideally as fast as possible).
Currently it is the CiC groups that pose most dramatic performance changes, and even the children themselves comment on their significant level of support.